The goal of investing is to earn a return, and for most, this return is about saving for retirement. This means most Americans have a time frame for their investment that is decades long, but it also means they have very little freedom to lose much money.
As a result, the nation’s favorite investment is stocks, and for good reason: the stock market has returned investors an average of 9% per year for 87 years! Great returns and consistent performance. Obviously, the past is no guarantee for how things will happen again, but dramatic changes would need to occur in our nation for nine decades of consistency to upend.
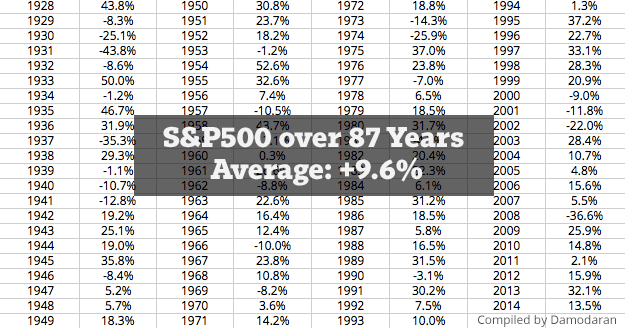
As a result, I myself am solidly in the stocks-for-growth camp as well. When looking at the data, it’s hard to find a better investment to grow excess cash.
However, this is where things can often become too simple. Many people start to trust the broad stock market so much that they underdiversify their life savings into it. “Dump it in the S&P500,” people say. “Put it all in VTI (Vanguard’s Total Stock Market ETF) and forget about it.”
There’s some logic behind this truism. Funds like the S&P500 and VTI are a decent yardstick of the entire US economy, with both the nation and the total stock market growing by leaps and bounds over time. But if someone’s entire life savings is placed solely in this one asset, investors are not truly diversified and are actually taking on a lot of needless risk.
Were the 2000s Really a Lost Decade?
A great example of this is the performance of stocks in the 2000s. Many investors call the 2000s a lost decade because the 10-year return of the overall stock market was historically dismal. Even the 1930s were better. If you had placed $10K into the S&P500 on January 1, 2000, ten years later your investment would have been worth $7500, a loss of -25%.
But investors often do not realize that the 2000s were actually great years for all sorts of other types of investments. Here is the yearly return of the S&P500 (some of the largest companies in America) versus mid-cap stocks (smaller companies worth $2-10 billion) during those same ten years:
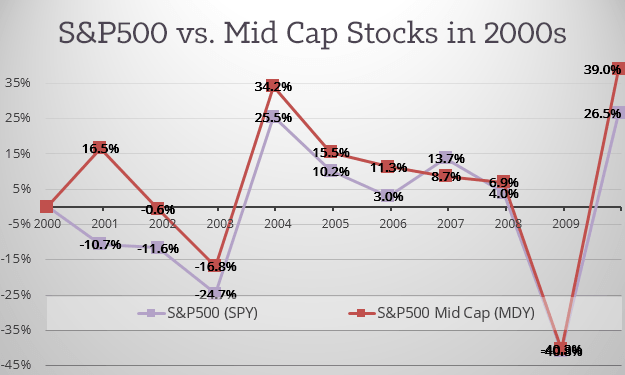
You can see the returns move together. They have strong correlation. If one moved up or down, typically the other did as well. However, they delivered quite different results over this 10 year span. That same $10K would have grown to $16,028 if placed in a mid-cap index like MDY.
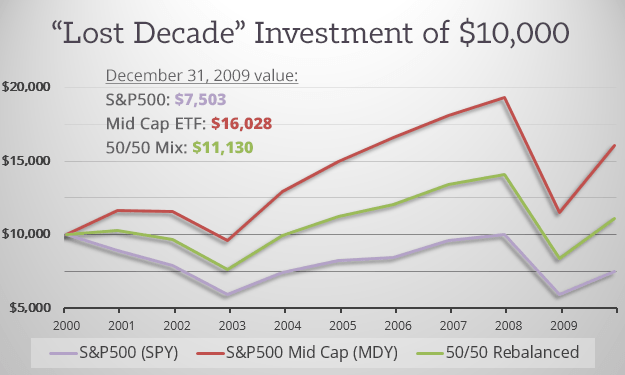
See the green line? This is what you would have earned had you diversified your $10,000 across both (rebalancing at the end of every year). Yes, with 50% in large caps during the 2000s you would have softened the healthy return of mid caps. But you would have avoided an overall negative return.
Different classes of investments move in different ways.
The point here is not to say a mid cap index is a better investment than a large cap index like the S&P500 (which is obviously not true). Neither is it to suggest a 50/50 large/mid cap portfolio is a good investment. My point is to show how different classes of investments move in different ways. Since we cannot predict which one will perform better, it’s important to diversify across a variety of them so to make our overall investment more consistent (and less stress-inducing).
What is an Asset Class?
So you can see the benefit of diversifying across multiple asset classes, or types of investments that move with some degree of independence from one another. Stocks have a variety of subclasses like large, mid, and small caps. Bonds are another asset class, as is real estate. And each of these asset classes perform somewhat independently from one another. A good year for stocks doesn’t really mean a good or bad year for bonds. Largely, each of their respective performance is uncorrelated with the other.
Here is a chart I compiled of the performance of every major asset class:
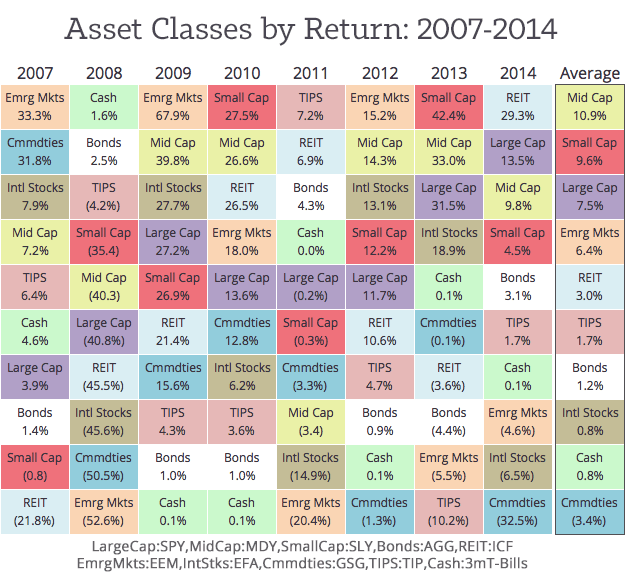
Two things stick out to me from this chart:
- The overall jumble of the picture. There is no fail-safe way to earn a short term return!
- Over the long term (and even including the ugliness of 2008) stocks continue to outpace almost everything else.
In my view, stocks should continue to be the main way we grow our retirement accounts. These 9% yearly returns is hard to beat. However, most investors should probably spread their cash across more than just the S&P500. By diversifying across the small and mid cap sub-classes, stock investors are likely to avoid having more lost decades in the years to come.
The Problem with Stock-Only Investing
The problem is that large and mid cap stocks are highly correlated investments. The same goes for other stocks: small caps, international stocks, and emerging markets (Read: SeekingAlpha). If one goes up, the others typically go up as well. As a result, a retirement account purely held in stocks is not as diversified and stable as it could be.
Ideally, you would invest in places outside of stocks, like in real estate and bonds. These investments are great because they give us a place to put our cash to work that is far less correlated to stock performance. If stocks tank, bonds and REITs are less likely to be affected. But they also have somewhat meager returns overall. As seen above, real estate has rewarded investors with just 3% per year since 2007. Bonds are even worse, returning just 1.2% per year.
Why You Need Peer to Peer Lending in Your Portfolio
But peer to peer lending has returned 7% on average to investors each year, and it is highly uncorrelated with stocks:
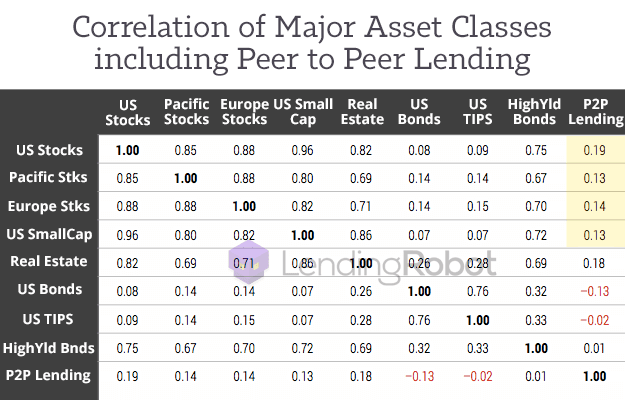
The above graphic is from a paper recently published by the investor tool LendingRobot: “How much should you invest in Marketplace Lending?”. In it, they did the math to discover how well peer to peer lending correlates with other asset classes. See the area highlighted in yellow? That is peer to peer lending’s correlation with stocks.
Peer to peer lending and stocks have very low correlation.
A correlation value of 1.0 would be a perfect correlation while a value of 0.0 is no correlation at all. So when compared to stocks, peer to peer lending has an average correlation of between 0.13 and 0.19, a very low overall correlation! It should be noted that asset class correlation does change, so it would be great to see how this value changes year by year.
In contrast to p2p lending, the four stock indices have correlations of 0.8 and 0.96 between themselves. They are very tightly correlated, so an investment with one will give somewhat similar performance to the other three. Simply spreading your cash across stock indices is not a very diversified investment.
For Growth Investors, Stocks with P2P Remains a Great Combination
As we near retirement, we need places where our cash can be kept safe. There are many low-risk investments like bonds that can care for our accrued cash, earning enough return to outpace inflation and ensuring our retirement years are focused on relationships, not financial worry.
However, most investors are looking for places to entrust cash that makes it grow. For these people, they should avoid the overly simple truism of placing their entire retirement into the S&P500, or into a total market index like VTI. Instead, investors should diversify their cash across a variety of asset classes and subclasses, giving their portfolio consistency and peace-of-mind.
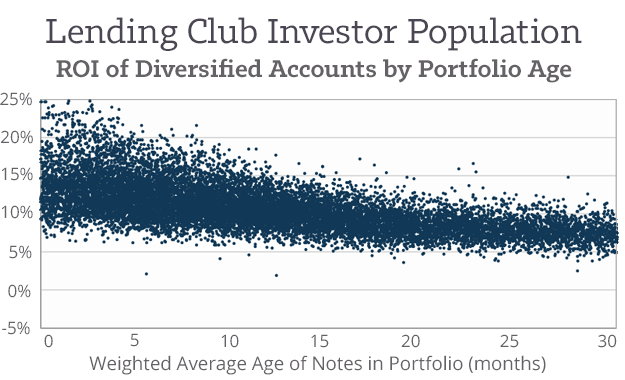
One great way to get that peace of mind is by placing 20% of our overall portfolio into peer to peer loans. Not only have they historically given investors a 5-9% return per year (depending how much risk is taken on), but their performance is also highly uncorrelated with stocks and bonds. By including peer to peer loans in their overall growth-investments, stock investors are more likely to experience consistent rewarding returns each decade, ensuring an eventual retirement that can solely focus on the people they love.
Image credit: Joe Lodge “125/365 Dolls in the Rain” CC-BY 2.0

Simon,
Great article! I concur with your thought process that folks should allocate a portion of their investment portfolio to this genre. I have now been lending for 7 years and my returns are pretty consistent and predictable. P2P was in its infancy and a different model back in 2008-2009 timeframe. While I suffered great losses on paper back then in my equity positions, I was…… and still am cash positive each and every year in marketplace lending.
To further diversify in this platform, one should not stop at just investing in Prosper and LC. I would recommend that looking into P2P real estate and business loans will further fill out your portfolio and decrease your risk.
Thanks, Jack
Solid advice. Thanks Jack. Always great to hear your testimony of online lending being your only positive investment in 2008.
Another great post Simon!
It will be interesting to see what happens in the next financial crisis we have. As we have seen a lot of correlations go to 1 during a time of crisis.
What time frame did LendingRobot use to conduct the study?
Cheers!
Hey Dominic. Thanks for the kind words.
I did not examine LendingRobot’s methodology. I’ll reach out and see what they say.
Great article – very thorough, specially the chart about the performance of every major asset class (2007 – 14).
The only part I think could have helped readers further is – how did you arrive at the 20% suggested portfolio allocation? That number ‘appears’ to be randomly chosen.
Otherwise a very well written article – lots of facts and figures, lots of rational arguments. Thank you!
Hi Aashish. You can read more about the 20% conclusion here: https://www.lendingmemo.com/stocks-bonds-lending-club-prosper/
Hi Simon – This is fascinating. I understand that P2P performance does not correlate with the stock market, but why not? It would seem that when the stock market goes down, the economy is bad, which should decrease people’s ability to pay back their loans. Am I missing something?
Overall good, but you’re putting too much emphasis on a 7 year history when you talk about p2p long term results. It’s so young that a major goal of the companies doing it is to tell people the industry exists. Who knows what it will look like in 20 years.
I think the analysis is misleading because stock returns are mark-to-market, whereas lending club returns are marked to fundamental. Concretely, if you only pay yourself the dividend or earnings yield and only mark down your stock position when your firm defaults, you’ll basically get the picture shown here:
http://econlog.econlib.org/2015/03/23/shiller3.jpg
Very smooth. Stock prices reflect the price you could immediately transact at to sell your security — it would be silly to think you could sell your non-defaulted junky LC notes at par in a crisis scenario, but this is never reflect in Lending Club returns.